
When researchers at the California Independent System Operator illustrated the duck curve in 2013, they probably never imagined the chart would one day symbolize the challenges of integrating renewables into the power grid.
The global-scale take-off of solar energy faces several major obstacles nowadays. The limitations mean that we must first find a solution before the technology is ready for full-scale adoption across the globe. Alongside space requirements for utility-scale installations and the environmental cost of solar production, the industry must contend with overproduction, famously called the duck curve.
What is the duck curve?
How does a duck relate to solar energy? They both have curves. In engineering, it is the comparability between peak power demand in the evening and excess generation of solar power during the day. This name was coined because when this scenario is put on the graph, it closely resembles a sitting duck.
The electricity consumption pattern is variable but predictable. Demand rises in the morning and tends to remain that way during the day. Then it peaks in the evening before reducing again later in the night.
Solar uptake means that most consumers don’t need grid-sourced power for the better part of the day. This scenario creates a Duck Curve. A diagrammatic representation of this scenario is shown below for the state of California (USA).
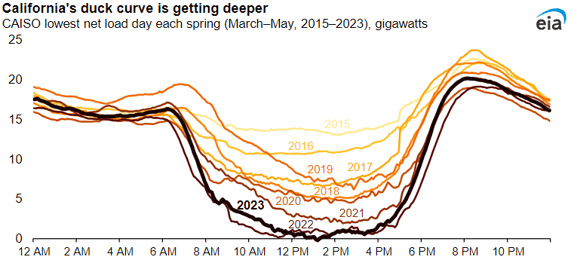
Fig 1: The Duck Curve for California (from this source)
What does the duck curve predict?
The duck curve predicts the instability of the power grid where the penetration of solar energy is high. Unlike a conventional power plant, solar power is not subject to scheduling. When a customer’s solar panels are generating power, the amount of power the customer is drawing from the utility grid reduces.
From the perspective of the grid operator, solar energy reflects a reduction in energy demand. Less of the power coming from the power plants is needed for supply to customers. While this demand reduction is predictable, it is not controllable.
Based on this prediction, grid operators no longer target total demand. The new target takes into account the contribution of solar energy. When solar power is deducted from the total demand, the result is referred to as “netload”.
Total Demand – Solar Power = Net load
Utilities have to meet this new load. The more the amount of solar energy grows, the more different the net load looks from the conventional load.
The most notable prediction of the curve is the level of loss that the utilities and power producers can encounter. For instance, sharp, tall bumps on the curve mean that the producer is forced to put online or take offline many power plants, swiftly.
Sometimes the duck can grow fat at the belly when the net load approaches zero at midday. Intermediate and peaker power plants may need to shut down in that case. After a few hours, these plants are ramped up. This is not only an expensive situation but also dangerous because it can eat into the reserve power.
How to Address Over-Generation of Solar Energy
For most complicated problems, there are several solutions. For the duck curve and the related over-generation challenges, options range from enhancing the flexibility of the grid to taking care of the peaks.
Energy storage is one of the most notable ways of flattening the duck curve. Other than sending the renewable energy directly to the energy grid, experts believe that it would be better to store it first. The stored energy would then be dispatched as and when needed. Battery storage is expensive to execute at the moment, but the good news is that prices for this technology are falling.
On its own, energy storage cannot overcome the duck curve. Energy efficiency, load flexibility, and other demand-side solutions can harmonize with energy storage and enhance the energy transition.
Improved building insulations alongside well-known efficiency improvement steps such as upgrading lighting and HVAC installations can reduce electricity demand.
Renewables can continue powering the grid in a more manageable manner through a two-way grid communication setup. Grid operators can be in control of electricity allocation in terms of demand. As a result, it becomes possible to shift the load to times when the renewable energy supply is high, without compromising user comfort.
Quick strategies to overcome the duck curve
For a comprehensive look at the solutions, Jim Lazar performed a study and came up with 10 strategies for overcoming the duck curve. Some are listed below:
- Promote energy efficiency for periods of energy demand spikes
- West-oriented solar panels
- Maximize surplus RE generation using electrical energy storage
- Use robust demand response programs
- Tie storage to solar PV systems
In conclusion, as the world tries to make the most of renewable energy resources, grid operators and utilities encounter a variety of challenges. The duck curve is a supply and demand challenge that can only be overcome with proper planning in readiness for even higher amounts of solar PV in the future.
It reminds us that the energy transition cannot succeed based on growing renewable energy supply alone. Applying demand-side measures is equally essential. Get in touch with us for more about different technological solutions for the use of RE energy resources.

